
THE US COAL MARKET PRIMER
January 2013
The following is a brief introduction to the US coal industry. This primer is designed for public interest in coal ETFs, coal exchange-traded-funds, investing in coal and trading coal. The information provided herein has been prepared solely for informational purposes and is not an offer to buy or sell or a solicitation of an offer to buy or sell the securities or instruments mentioned or to participate in any particular trading strategy.
The data presented below is derived from information released by various third-party sources. The information has not independently verified. The third-party sources from which certain of the information presented below include the U.S. Energy Information Administration and BP Statistical Review of World Energy 2012.
General
Coal is a safe, reliable, easily stored and readily available source of energy. Coal is produced in over 50 countries, consumed in over 70 countries and traded globally. Coal is a low-cost fossil fuel used primarily for electric power generation. Coal is typically significantly less expensive than oil, and coal is generally competitive with natural gas and nuclear power generation.
Coal is also used to produce steel (coal is used in nearly 70% of global steel production) and used by a variety of other industrial consumers to heat and power foundries, cement plants, paper mills, chemical plants and other manufacturing and processing facilities.
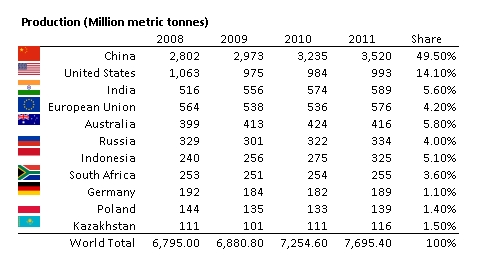
The United States holds the world's largest estimated recoverable reserves of coal, is the world’s second largest producer and consumer of coal and is the world’s 4th largest exporter of coal. In 2011, US coal mines produced more than a billion short tons of coal. More than 90% of this coal was used by US power plants to generate electricity.
Coal is the fastest growing source of fossil fuel in the world, adding more to absolute world energy supply in the last decade than almost all other forms of energy combined. Coal accounts for 30% of global primary energy consumption. In 2011, over 7.7 billion metric tones of coal were produced globally, valued at approximately $700 billion.
Types of coal
Coal is classified into four general categories, or “ranks,” based on carbon content. Carbon is the source of coal’s heating value, but other factors also influence the amount of coal’s energy per unit of weight. The amount of energy in coal is expressed in British thermal units (“BTU”) per pound. A BTU is the amount of heat required to raise the temperature of one pound of water by one degree Fahrenheit.
The four ranks of coal include lignite, sub-bituminous, bituminous and anthracite.
Lignite is geologically young coal that has the lowest carbon content (approximately 25% to 35%), and consequently the lowest energy content, of the four ranks of coal. Lignite has a heat value ranging between 4,000 and 8,300 BTUs-per-pound. Sometimes called brown coal, lignite is mainly used for electric power generation primarily in power plants close in proximity to the source.
Sub-bituminous coal contains about 35% to 45% carbon and has a heat value between 8,300 and 13,000 BTUs-per-pound. Approximately half of the coal produced within North America is sub-bituminous. Although the heat value of sub-bituminous coal is lower than bituminous, it tends to be lower in sulfur content and cleaner burning.
Bituminous, or black coal, is the most abundant type of coal. Bituminous contains approximately 45% to 86% carbon and has a heat value between 10,500 and 15,500 BTUs-per-pound. Bituminous has little water content or other impurities except for sulfur, and is easily ignited.
Anthracite coal contains approximately 92% to 98% carbon and has a heat value of nearly 15,000 BTUs-per-pound. Anthracite has a heat value greater than that of Bituminous, but is hard to light, scarcer and more expensive.
Coal mining
Coal is extracted from the ground by mining, either in open pits or underground by shaft mining through the seams.
Surface mining
- Strip mining exposes the coal by removing the overburden (the earth above the coal seam(s)) in long cuts or strips.
- Contour mining removes overburden from the seam in a pattern following the contours along a ridge or a hillside.
- Mountaintop removal removes the tops of mountains to expose coal seams and disposing of mining overburden in adjacent “valley fills."
Underground Mining
Most coal seams are too deep underground for surface mining and require underground mining, which currently accounts for about 60% of world coal production.
- Longwall mining accounts for about 50% of underground production. It is a sophisticated machine with a rotating drum that moves mechanically back and forth across a wide coal seam.
- Continuous mining accounts for about 45% of underground coal production. A continuous mining machine has a large rotating steel drum equipped with tungsten carbide teeth scrapes coal from the seam.
- Blast mining or conventional mining is an older practice that uses explosives to break up the coal seam.
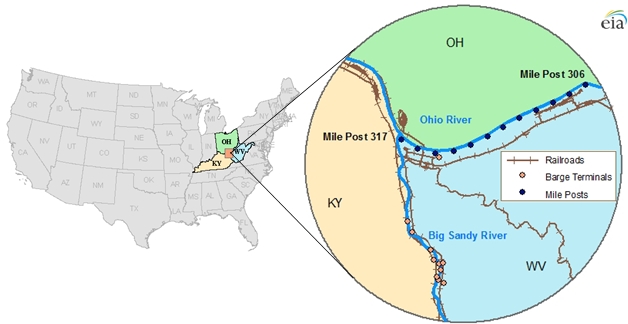
Transportation
Domestically, coal is moved primarily by barge and rail, although it may initially move by truck from the mine.
Ships are commonly used for international transportation, in sizes ranging from:
- Handysize - 40-45,000 DWT
- Panamax - about 60-80,000 DWT
- Capesize vessels - about 80,000 DWT
Coal mining regions
Coal is mined in the United States in 25 states. Wyoming mines the most coal, followed by West Virginia, Kentucky, Pennsylvania and Montana. Coal mining in the United States primarily takes place in three regions:
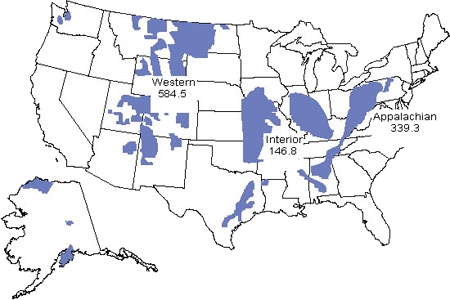
Appalachian Coal Region. More than one-third of the coal produced in the United States is produced in the Appalachian coal region. West Virginia is the largest coal-producing state in the region, and the second largest coal-producing state in the United States. Coal mined in the Appalachian coal region is primarily used for steam generation for electricity and metal production and for export. Norfolk, VA is the largest U.S. coal export terminal. Hedging contracts are CME Central Appalachian Coal Futures (symbol “QL”) and CME CSX Coal Futures (symbol “QX”).
Western Coal Region. Over half of the coal produced in the United States is produced in the western coal region, which includes the Powder River Basin. Wyoming is the largest regional coal producer, as well as the largest coal-producing state in the United States. Eight of the top ten producing coal mines in the United States are located in Wyoming. Some of the largest coal mines in the world are in the western coal region. The hedging contract is CME Powder River Basin Coal Futures (symbol “QP”).
Interior Coal Region. Texas is the largest coal producer in the interior coal region, accounting for almost one-third of the region’s coal production.
Coal benchmarking
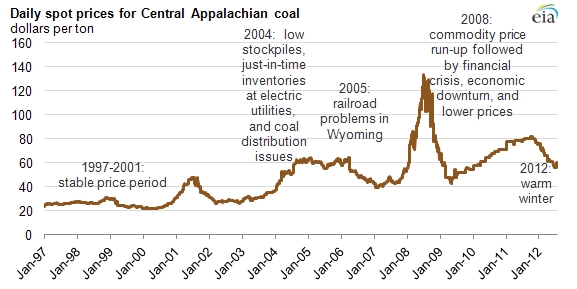
Central Appalachian (CAPP) coal spot prices are the most widely referenced prices for eastern coal in the United States. Coal producers, electric utilities, merchant generators, non-utility industrial coal users and other energy marketers use CAPP spot coal prices to price both physical and financial transactions for short-term and long-term contracts.
CAPP spot prices reflect the value of Central Appalachian coal in the CAPP Delivery Zone location. CAPP spot prices do not reflect transportation costs to deliver coal from the delivery zone to a power plant or other facility, any emission abatement costs nor other handling charges.
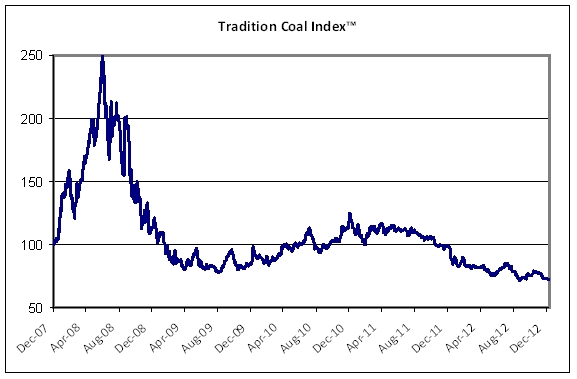
The Tradition Coal Index™ (“TRCOAL™”) benchmarks investments in the CAPP coal market. The index measures coal market performance over time.
International Coal
Global coal production grew by 6% in 2011, the only fossil fuel to record above-average growth and the fastest-growing form of energy outside renewables. Coal accounts for 30% of global energy consumption, the highest share since 1969. Consumption outside the OECD rose by an above-average 8%, led by Chinese consumption growth of 10%.
Notable statistics about the global coal market include:
· China, the US and Europe are the world’s 1st, 2nd and 3rd largest consumers of
coal, respectively.
· Coal produces 42% of the world’s electricity generation.
· Coal produces 80% of China’s electricity generation.
· Coal is 50-93% of emerging market electricity generation.
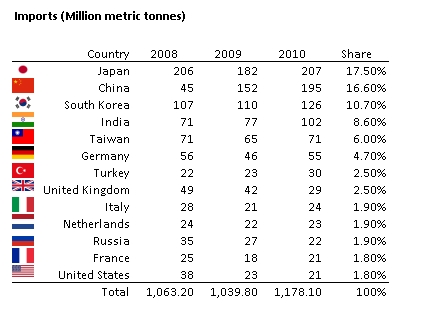
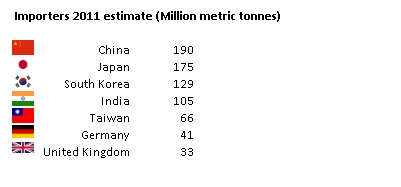
· The EU, China, Japan, Korea and India are the world’s top coal importers.
· The EU is the world’s largest importer of coal at 25% of total global imports.
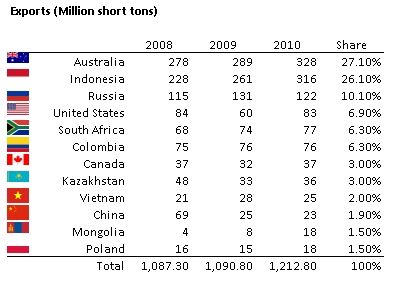
· The US is the world’s 4th largest coal exporter.
· Global coal production is over 7.7 billion metric tonnes.
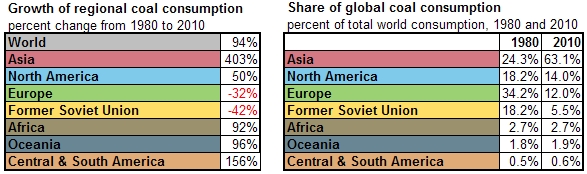
Global coal demand has almost doubled since 1980, driven by increases in Asia, where demand is up over 400% from 1980-2010. In turn, Asian demand is dominated by China. Demand in China increased almost five-fold between 1980-2010 and accounted for 73% of Asia's consumption and almost half of coal consumption globally in 2010.
Coal consumption growth has shifted from Europe and the FSU to Asia. Europe and the FSU were the only two regions with declining coal consumption between 1980 and 2010, falling 32% and 42% respectively. Asia's share of global coal use rose from 24% to 63% during this period (see chart). Asia's growing coal demand has fueled large increases in global coal production.
International coal pricing is becoming increasing transparent and accessible with growing use of exchange-traded futures contracts. The CME and ICE list financially-settled coal contracts for Europe, South Africa and Australia coal market hedging. The European coal futures contracts (API2) are based on the price of delivered coal into northwest Europe (ARA). The South Africa coal futures contracts (API4) are based on the price of FOB coal loadings in Richards Bay, South Africa. The Australian coal futures contracts are based on the price of FOB coal loadings in Newcastle, Australia.
US coal exports
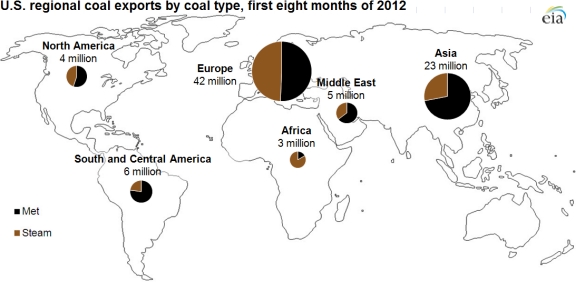
The US is the world’s 4th largest coal exporter. About 75% of US coal exports were shipped to Europe and Asia in 2012, continuing the growth of the past few years with exports expected to reach an all-time high in 2013. Despite growing demand in Asia, the US exports slightly more coal to Europe than it sends the rest of the world combined.
US coal exports to Europe are primarily serviced out of the East Coast via Norfolk, Virginia (the largest coal export facility in the United States) and Baltimore, Maryland (the third largest). Exports to Asia originate mostly from the East Coast. Most coal out of Baltimore—almost double the port's European volume—is destined for Asia, the world's largest coal consuming region.
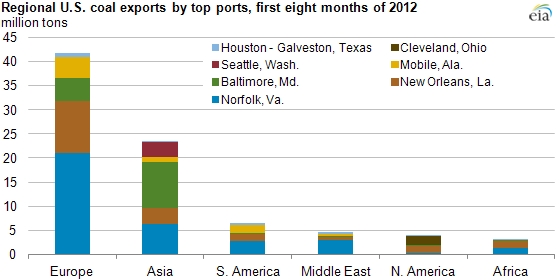
US coal exports are largely concentrated in a few facilities, with the leading seven ports accounting for 94% of U.S. exports. Norfolk, VA, the largest coal port, shipped almost 35 million tons of coal from January through August 2012, accounting for nearly 40% of total US exports.
With access to barge shipments down the Mississippi River, exports out of New Orleans, LA have grown from around one million tons in 2000 to more than 19 million tons in the first eight months of 2012, making it the second highest volume US coal port. Among the top export facilities, only New Orleans and Seattle primarily export steam coal.
Growing global steam coal demand is fueling 2012 exports to an expected all-time high. High European natural gas prices have contributed to increased imports of US steam coal.
Coal price drivers
Coal is a truly globally traded commodity and the dynamics of price are influenced by a complex variety of factors ranging from world demand for steel, winter temperatures and natural gas prices to rains in Indonesia and floods in Australia. Examples of factors that alter the supply and demand balance and thus affect the price of coal include:
· Price of natural gas
· Export demand
· Freight rates
· USD exchange rates
· Weather (temperature)
· Changes in coal mining capacity, productivity and depletion rates
· Changes in electric power production
· Changes in regional electricity generation capacity
· Changes in government subsidization
· Environmental regulation
· Climate events (i.e., floods, rains)
· Availability of mining equipment and skilled labor
· Steel production
· Industrial utilization
A significant factor impacting US coal demand is the price and availability of US natural gas. During the 1990s and 2000s, the cost of natural gas generation decreased with the increased use of efficient combined cycle technology for power generation. Expansion of the natural gas pipeline network decreased uncertainties around natural gas availability. Natural gas production gains from domestic shale gas formations began to rapidly increase starting in 2005. Rising shale natural gas production outpaced natural gas demand growth and contributed to falling natural gas prices while coal prices rose.
Starting in 2009, these trends began to alter the relative economics affecting the dispatch of generators relying on Appalachian coal and natural gas in the eastern half of the country. Gas-for-coal fuel switching has been most extreme in deregulated electric power states where much power is bought and sold on the spot market through daily auctions operated.
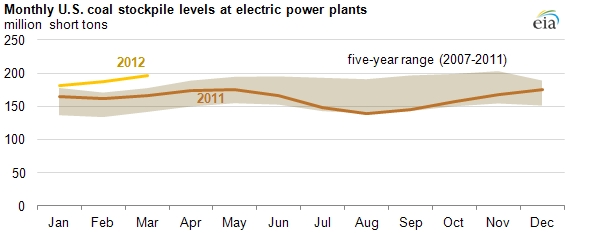
The continued decline in natural gas prices has encouraged power plant operators to use combined-cycle units to fulfill baseload power demand, displacing some coal generation. When natural gas gets low enough, such as it did during 2012, more natural gas fired generators get scheduled to produce electricity ahead of coal-fired generators.
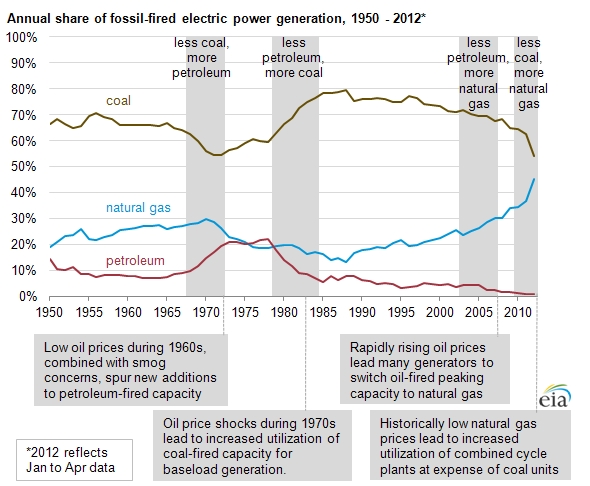
April 2012 electric power data show that, for the first time since EIA began collecting the data, generation from natural gas-fired plants is virtually equal to generation from coal-fired plants, with each fuel providing 32% of total generation.
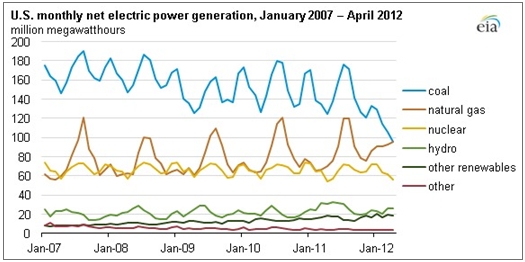
Factors other than fuel prices played important roles in determining which power plants are run to meet electricity demand. One important factor is the availability of generating capacity. Between 2000 and 2012, natural gas generating capacity grew by 96%. In contrast, additions to coal capacity were relatively minor during that period and petroleum-fired capacity declined by 12%. Other factors include: generators' nonfuel variable operating costs, startup/shut down costs, emission rates and allowance costs, transmission constraints on the electricity grid, and reliability requirements. Electricity system operators evaluate all of these factors when determining which plants and fuels to use.
Global statistics
The information provided herein has been prepared solely for informational purposes and is not an offer to buy or sell or a solicitation of an offer to buy or sell the securities or instruments mentioned or to participate in any particular trading strategy. These materials have been based upon information generally available to the public from sources believed to be reliable. No representation is given with respect to their accuracy or completeness, and they may change without notice. Tradition on its own behalf and on behalf of its affiliates disclaims any and all liability relating to these materials, including, without limitation, any express or implied representations or warranties for statements or errors contained in, or omissions from, these materials. Tradition does not make markets or specialize in, or enter into principal or proprietary positions (long or short) in securities and commodities. Tradition does not perform or seek to perform investment banking. Any data consists of purely indicative prices and should not be relied upon to revalue any commercial positions held by any recipient. Tradition makes no warranty that the data represent or indicate prices at which transactions may be or have been made by any Tradition Group company. To the maximum extent of the law, Tradition accepts no responsibility for, and cannot and does not warrant the integrity, accuracy, quality, completeness, merchantability or suitability for a particular purpose or requirement of the information or data, even if arising out of the negligence of Tradition or otherwise. Tradition accepts no liability for any direct, indirect or other consequential loss arising out of any use of the information contained in this document or any omission from it.